gpt-image-2 Prompt Patterns: Technical Diagrams And Infographics
Rewritten English prompt patterns for turning architecture notes, technical mechanisms, and Mermaid flows into readable gpt-image-2 visuals.
Technical images fail in two opposite ways.
One version includes everything and helps no one. The other looks polished but quietly breaks the mechanism it is supposed to explain.
The prompts here try to solve that by forcing the model to compress first, then design. The main path, node roles, arrows, labels, and bottom-line conclusion matter more than decoration.
These examples use English prompts and English inputs. They are adapted from public prompt ideas shared by @xiaoxiaodong01 and @MrLarus, then rewritten and tested again with gpt-image-2.
Chinese version of this article
Case 1: Hand-Drawn Knowledge Diagram
Developers often need diagrams that explain a mechanism without becoming a cold flowchart.
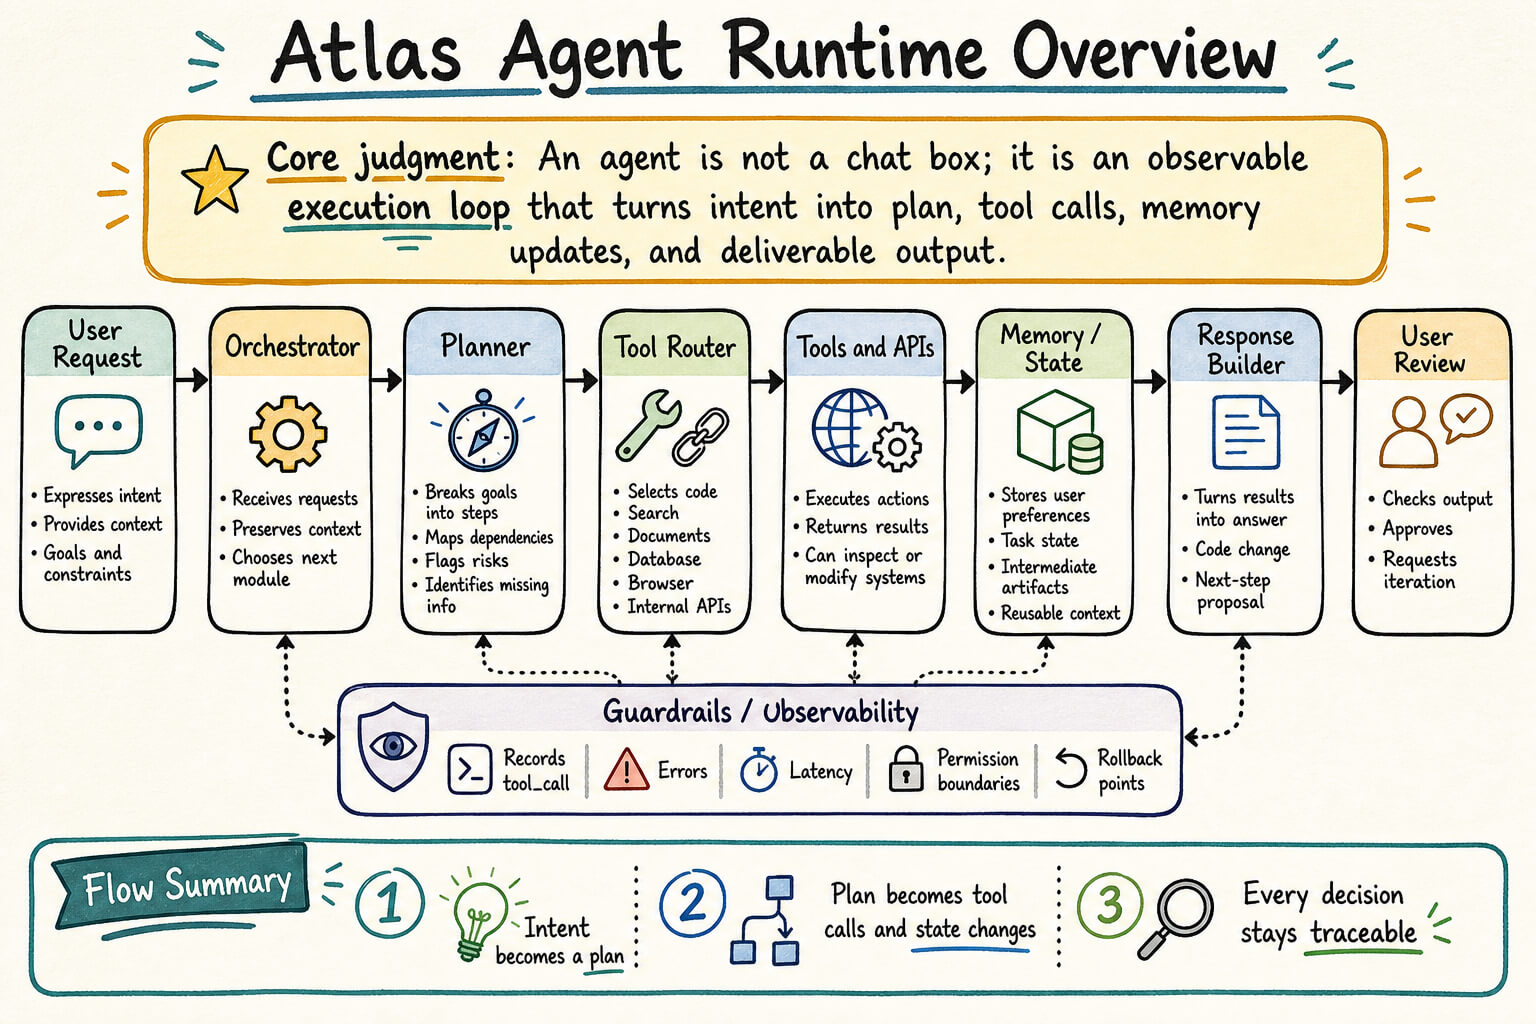
I tested this prompt with an “Atlas Agent Runtime Overview”. The useful part is that the prompt asks the model to preserve the technical path while turning the content into a readable hand-drawn explainer: title, judgment, modules, arrows, observability layer, and a bottom flow summary.
The result keeps the main path visible and the English text is mostly readable. For production use, I would still keep the input under six modules. Beyond that, the model starts trading readability for completeness.
Generation notes:
- Model:
gpt-image-2 - Size:
1536x1024 - Output: JPEG, about 297 KB after compression
- Test input: Atlas Agent Runtime Overview
- Best for: architecture summaries, technical explainers, retrospectives, internal sharing visuals, knowledge cards
Test input:
Atlas Agent Runtime Overview

Core judgment:
An agent is not a chat box; it is an observable execution loop that turns intent into plan, tool calls, memory updates, and deliverable output.

Main path:
User Request -> Orchestrator -> Planner -> Tool Router -> Tools and APIs -> Memory / State -> Response Builder -> User Review

Key modules:
1. Orchestrator receives requests, preserves context, and decides the next module.
2. Planner breaks goals into steps, dependencies, risks, and missing information.
3. Tool Router selects code, search, documents, database, browser, and internal APIs.
4. Memory / State stores user preferences, task state, intermediate artifacts, and reusable context.
5. Guardrails / Observability records tool_call, errors, latency, permission boundaries, and rollback points.
6. Response Builder turns execution results into an answer, code change, or next-step proposal.

Bottom Line:
A maintainable agent makes every decision, every tool call, and every state change traceable.
Reusable prompt:
Create a highly readable hand-drawn knowledge diagram from the content I provide.

The style should feel like a carefully organized creative notebook, a whiteboard walkthrough, and a consulting-style explainer. It should not look like a cold template or a generic flowchart.

Goal:
Generate a diagram suitable for sharing, presentation, and reuse. The viewer should first understand the core judgment, then follow the modules, and finally remember one bottom-line conclusion.

Language:
All visible text should follow the language of the input. Do not mix languages unless the input contains product names, protocol names, code tokens, paths, or numeric metrics.

Canvas:
- Aspect ratio: {16:9 / 5:4 / 4:3 / 21:9}
- High-resolution output
- Warm off-white or light warm-gray background
- Subtle paper texture and enough breathing room
- Keep all text readable; do not squeeze content into tiny labels

Information design:
- Do not copy the source text word for word. Compress first, then draw.
- Structure the image as:
  1. Top: strong title plus one-sentence core judgment
  2. Middle: 3 to 6 main modules arranged by flow, comparison, phase, or cause and effect
  3. Inside each module: up to 3 to 5 short bullets
  4. Bottom: one Flow Summary, Decision Summary, or Bottom Line
  5. If the input is dense, keep only the 8 to 10 most important judgments

Readability:
- The title must be the largest and clearest element.
- Module titles should feel ordered.
- Body text must be short.
- Each module should avoid more than six body lines.
- Avoid dense tables and tiny technical paragraphs.
- Do not sacrifice readability for completeness.

Visual style:
- Use dark ink or black hand-drawn lines to build the reading structure.
- Use rounded sections, fine frames, light shadows, numbering, arrows, labels, and small icons.
- Lines may have slight hand-drawn irregularity, but alignment, margins, and grouping must stay stable.
- Icons are secondary wayfinding elements, not the main visual hierarchy.

Color:
- Warm paper background plus dark ink lines.
- Use restrained marker colors such as low-saturation teal, sage, muted lavender, soft orange, and pale blue.
- Avoid neon colors, strong gradients, heavy commercial glow, and one-color monotony.
- Colored areas should occupy a small to medium part of the image.

Accuracy:
- Preserve the technical chain, component names, arrow direction, protocols, ports, data flow, and judgments in the input.
- Do not invent components that were not provided.
- Do not reverse actions. For example, "read logs" must not become "generate logs".
- If space is limited, preserve the main path, key distinctions, and final judgment; remove secondary explanations.

Content:
{paste your content here}
Case 2: Reconstructing A Mermaid Flow As A Technical Infographic
Mermaid is great inside documentation. It is not always good enough for a presentation slide or article cover.
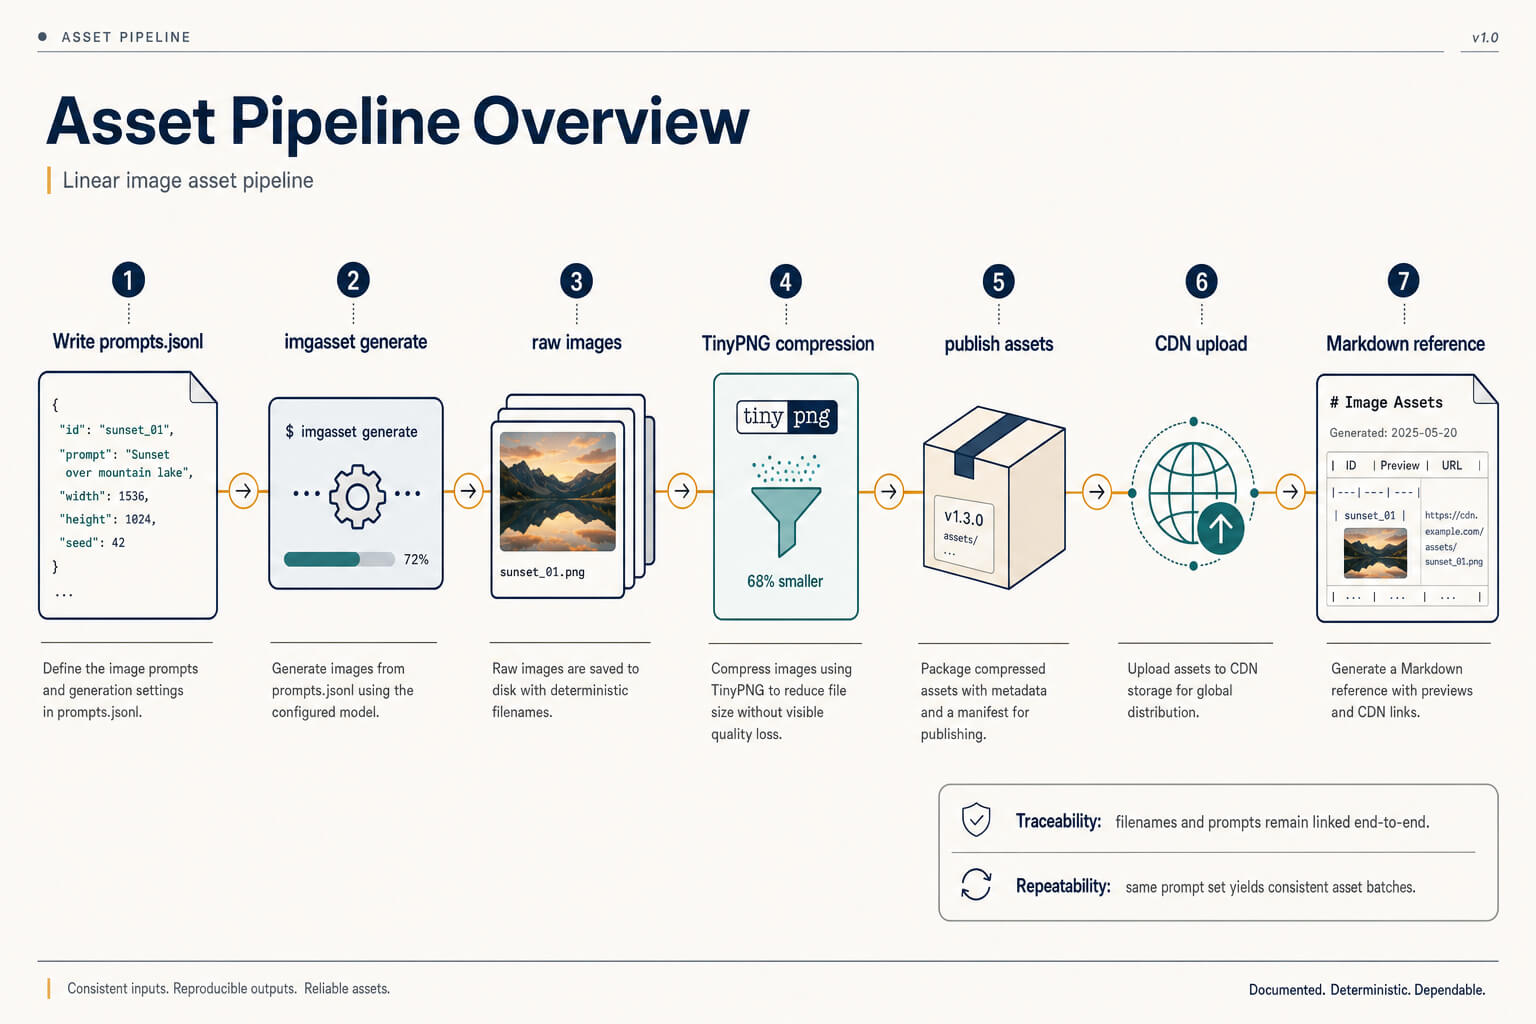
I tested this with an image asset pipeline: write prompts.jsonl, generate raw images, compress them, publish assets, upload to a CDN, and reference them from Markdown. The original Mermaid flow is already clear, but visually it still feels like an engineering sketch.
This prompt does not ask for “a prettier Mermaid chart”. It asks the model to extract the mechanism, assign node roles, and redraw the flow as a technical editorial infographic.
Generation notes:
- Model:
gpt-image-2 - Size:
1536x1024 - Output: JPEG, about 128 KB after compression
- Test input: a Mermaid flow for an image asset pipeline
- Best for: technical documents, architecture walkthroughs, workflow explanations, presentation slides
Test input:
flowchart LR
  A[Write prompts.jsonl] --> B[imgasset generate]
  B --> C[raw images]
  C --> D[TinyPNG compression]
  D --> E[publish assets]
  E --> F[CDN upload]
  F --> G[Markdown reference]
Reusable prompt:
You are a senior information architect and technical infographic designer.

Task:
Redesign the provided Mermaid / C4 / Flowchart / Sequence / State / ER / Timeline source, or a rendered diagram image, into a high-fidelity professional technical infographic.

The goal is not to beautify the original diagram, not to replicate Mermaid, and not to reskin a normal flowchart. First understand the semantic structure, then recompile it into a new information architecture.

Output:
Generate only the final infographic. Do not output analysis, Markdown, source code, or design notes.

Input truth rules:
1. If the input is source code, the source is the semantic truth. Ignore original Mermaid layout, colors, class definitions, and node styles.
2. If the input is an image, use it only for semantic extraction. Do not copy the original layout, palette, node shapes, or arrow paths.
3. If the source image is blurry, keep only confirmed information. Do not invent business logic.

Semantic extraction:
Extract entities, groups, actors, relationships, branches, merges, loops, gates, tools, stores, schemas, states, outputs, triggers, annotations, dependencies, and observations.

Role assignment:
Assign a role to each entity:
input, output, controller, orchestrator, processor, resolver, decision, gate, tool, storage, observer, actor, artifact, annotation, boundary, event, state, terminal, or reference.

Primary mechanism:
Identify one primary mechanism and make it visible within three seconds.
Possible mechanisms include:
pipeline, orchestration, resolver pipeline, gating, handoff, layered system, lifecycle, hub-and-spoke, dependency network, sequence interaction, state transition, artifact-centered flow, split decision tree, release flow, or deployment flow.

Primary path:
Extract the main path:
input -> controller / processor / decision / resolver -> output.
Make this the visual spine. Auxiliary relationships should become branches, loops, lookup lines, observation lines, dependency lines, or side annotations.

Template selection:
- Linear primary path with 7 or fewer major steps: Core Flow Spine
- Central controller with 3 or more branches: Orchestrator Hub
- Runtime / gateway / engine / tools / storage: Layered Blueprint
- Validation or conditional branching: Split Gate
- Multi-actor interaction: Swim Relay
- User action plus internal state toggle: Interaction State Panel
- Artifact or version resolves execution: Artifact Anchor Resolver
- Entity relationship: Relational Data Grid
- Dense dependency graph: Clustered Zones
- Lifecycle or state transition: Lifecycle Ring

Style:
Use a premium technical editorial style by default:
- warm off-white or soft technical canvas
- restrained surfaces
- modern clean sans-serif typography
- low-saturation navy, teal, amber, and gray accents
- subtle paper grain or micro-grid if useful
- no heavy shadow, glow, glassmorphism, 3D, rainbow palette, or loud gradient

Information compression:
- Merge similar nodes when there are more than four.
- Expand the main path and fold secondary capabilities.
- Each node should keep only name, role, and key constraint or output.
- Use code-like tokens for technical terms, such as `tool_call`, `final_output`, `SQLite`, or `prompts.jsonl`.
- Avoid dense tiny tables.

Visual hierarchy:
- The controller, orchestrator, or core object has the strongest weight.
- The main path is the clearest and most continuous line.
- Output or terminal nodes must feel like a clear conclusion.
- Decision or gate nodes must look like important judgment points.
- Storage should feel grounded and quiet.
- Observability or tracing should use low-contrast dashed lines.
- Tools should feel callable, not equal to the main flow.

Connection rules:
- Sequential flow: strongest line
- Branch / merge: secondary line
- Loop: curved return line
- Handoff: restrained highlight
- Lookup / reference: thin line
- Observation: low-contrast dashed line
- Dependency: desaturated structural line
- Bidirectional exchange: two-way connector
- Traceability: fine dashed line

Hard bans:
- Do not make a prettier Mermaid chart.
- Do not preserve the original subgraph boxes by default.
- Do not make every node the same size.
- Do not add oversized icons.
- Do not use rainbow colors, heavy shadows, glow, 3D, glassmorphism, or dense text.
- Do not invent missing information.

Input:
{paste Mermaid source or diagram content here}